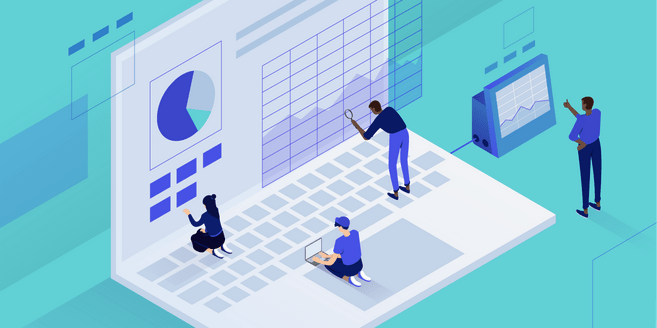
Today’s IT teams have the luxury of choosing from a huge variety of APM (application performance monitoring) tools, some more costly than others. But even working with some of the less complex solutions can be tricky and success depends not just on the quality of the tool but on how well it’s implemented. Further, assuming a top-notch APM product and perfect implementation, there’s still the matter of knowing how to interpret data and choosing which data sets are of use to your business.
To get the most out of whichever product you select, it’s important to begin with some core principles about general solutions. Additionally, focus on a handful of best practices that can help IT and management teams maximize the effectiveness of whatever strategies and products they employ to monitor application performance. Here are nine ways to make the most of any app performance tool.
Know the Key Differences Between App and Web Monitoring
First things first are that web performance monitoring is the more aptly named term of the two because it more accurately describes its main goal, which is finding out whether a given website is usable and is performing as it should. Both RUM and synthetic techniques are used in WPM, and work well together for seeing what the end-user experience is really like. App performance management is more focused on performance parameters that are invisible to the end-user and tends to look inside the various applications to identify problems with code-related instrumentation. Note that companies that sell retail solutions often combine WPM and APM products under the single heading of the latter.
Configure For Kubernetes If Necessary
When you decide which APM solution you wish to install. The core concept behind understanding Kubernetes performance is that you’ll need to do a three-part implementation (to both configure and install) process if your goal is to operate in a Kubernetes environment. What are the three separate steps? First, you’ll have to focus on all the cluster’s nodes separately. Namely, the IT team will need to configure (after installing it) a specific report/collection component. Second, it’s necessary to equip each app with a tracing module for the sole purpose of gathering trace statistics, or data. Third, check the local node and make sure you’ve configured it so that the collection component and trace agent can communicate with each other.
Understand How Digital Experience Monitoring (DEM) Works
More user-oriented than many other approaches, DEM is divided into real-user and synthetic categories. When IT teams want to hone in on front-end discrepancies, they employ real-user testing while people are interacting with the site. As opposed to this field-based strategy, synthetic techniques create lab-based situations that actively measure how a site behaves, even though the conditions aren’t based in the real world of users. There’s no better way for gaining insight into what people actually see and experience when they attempt to use a commercial website.
Master Debugging With CLD
Many APM products include high-level debugging capabilities that give teams the power to identify and correct particular lines of faulty code. In fact, there are multiple reasons for performance slowdowns, and these components of an overall app performance solution can help discover whether the code-related issue is simply a query that’s running too slowly, a loop, a synchronization snafu, or something else.
Troubleshoot With DTT (Distributed Transaction Tracing)
Because code-based malfunctions are at the root of most app performance problems. DTT functionality can help identify whether the particular challenge is related to an algorithm gone bad, exceptions that are not being handled, leaks within core memory, or another code-related error. When you employ DTT troubleshooting, it’s easy enough to gain total visibility and view a given request’s pathway from start to finish.
Customize Your Favorite Tools
Don’t expect to use off the shelf products as they arrive. Nearly all products in this competitive niche allow you to create a wide range of metrics that are fully customized according to your company’s particular goals and needs. Keep in mind that most retail APM offerings have the capability to create huge volumes of data, only a portion of which are relevant or helpful to any one organization in most cases.
Leverage the Power of Time-Based Metrics
Why not use all the data you collect during the APM process to make accurate predictions about future performance? It’s possible to do so by looking at metrics that are strictly time-based. Even better, when teams employ a long-term approach and gather information for a lengthy duration, they can gain key insights into repeating patterns, possible future problems, problematic symptoms that recur with great frequency, and other such issues.
Don’t Ignore Real-Time Alerts
It’s one thing to make predictions based on long-term data collection, but quite another to discover immediate problems as they pop up. The importance of real-time alerts should not be overlooked. They help spot under-used capacity and can warn you in real time if usage is about to max out and overload the system.
Do All-Around Monitoring
No product or method is sufficient as a stand-alone method for monitoring app performance. The larger your digital environment, the more essential it is to take an eclectic approach, combining products, troubleshooting techniques, real-user-monitoring, synthetic testing, historic data collection, real-time alerts, and more. Of course, when you uncover a potential problem, it often makes sense to use the particular tools and techniques that do the best job of resolving it.


Add Comment